XXXXXXXXXXXXXX
Google Analytics is considered one of the best tools to measure the performance of a website. But it can often become difficult to figure out what different reports mean and how they relate to earnings.
For this reason, we have prepared an ultimate guide to Google Analytics – a collection of everything you need to know to promote your business using Google Analytics data.
Though it’s necessary to track the performance of a website, there are several website owners who don’t even know how user engagement impacts the SEO score of a website.
According to a stat by W3Tech, only 56.1% of all the websites have Google Analytics integrated.
Let start with some basics.
Why You Should Integrate Google Analytics
Do you have a website? Do you want to improve its online presence? If the answer is yes, then you are definitely going to need this tool. That’s because your Analytics account can tell you the following:
-
- Number of sessions in a particular period
- Top locations where your audience is visiting from
- Type of website content getting the most number of visits
- The most active sources and mediums where you are getting traffic from
- Types of devices your visitors are using
- Fields of interest of your audience
- User behaviour
- Bounce rate of the website or a particular page.
- Track Conversions
- Load Speed
To create a Google Analytics account, you need to have a verified Google account. Go to “https://www.google.com/analytics/”, log in with your Google account details and follow the steps mentioned here.
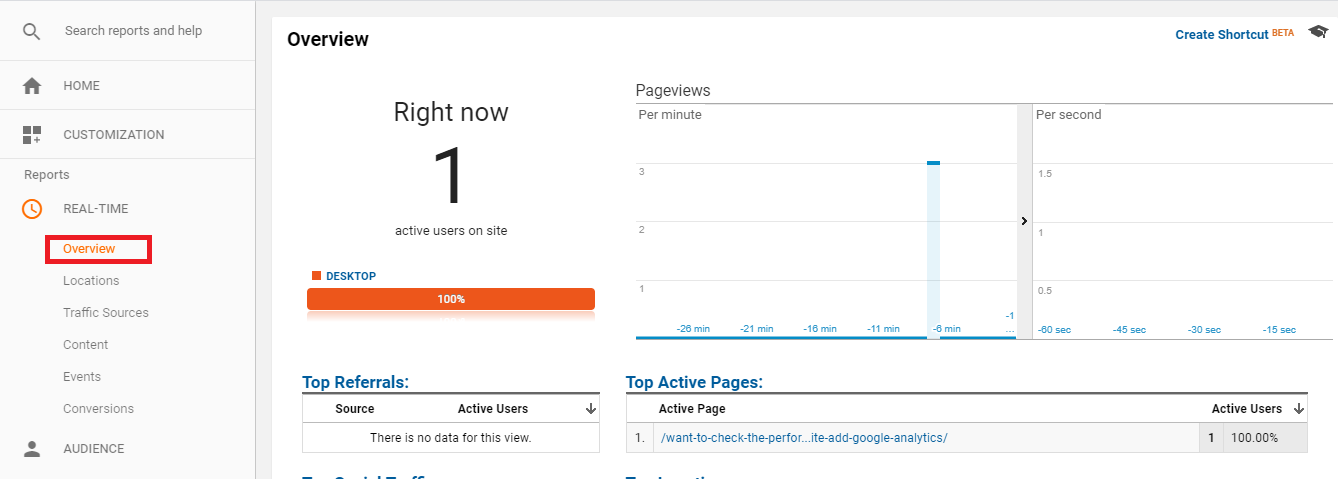
If you want to check whether your Google Analytics tool is properly tracking the traffic of your website, just visit any of its pages and go to Real-Time Data > Overview from the left sidebar on your account page.
If it shows the location and the page properly, then everything is all right with the tracking code installation. If not, you may need to reinstall the code or try the other strategies suggested by Google Analytics.
Google Analytics will take at least 24 hours to show you the data. To get better insight, give it a week’s time so that it can gather a good number of interactions.
Here are some basic yet useful data points that you should start tracking as soon as possible.
1. Number of sessions in a particular period
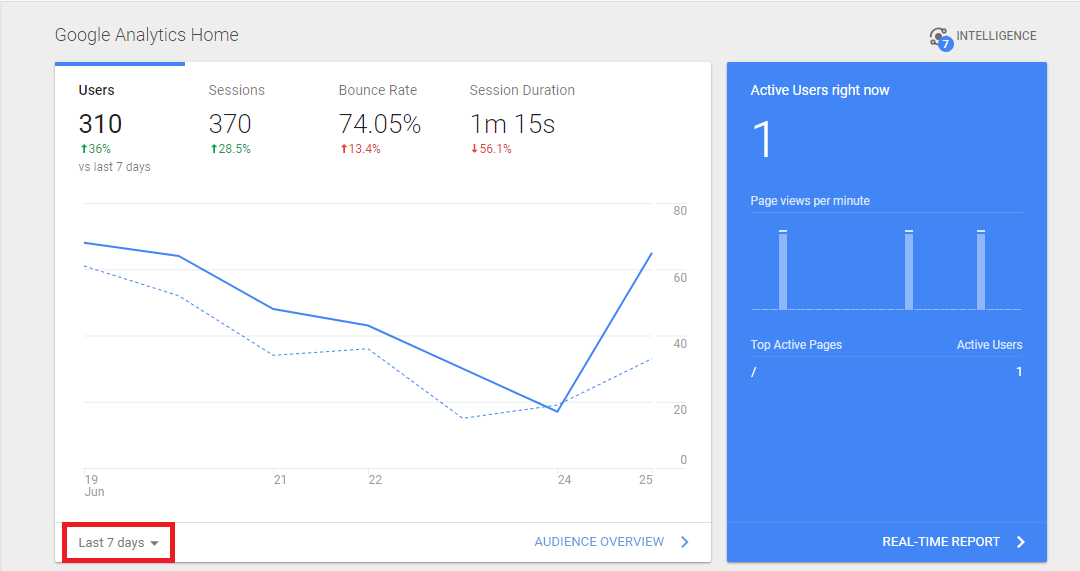
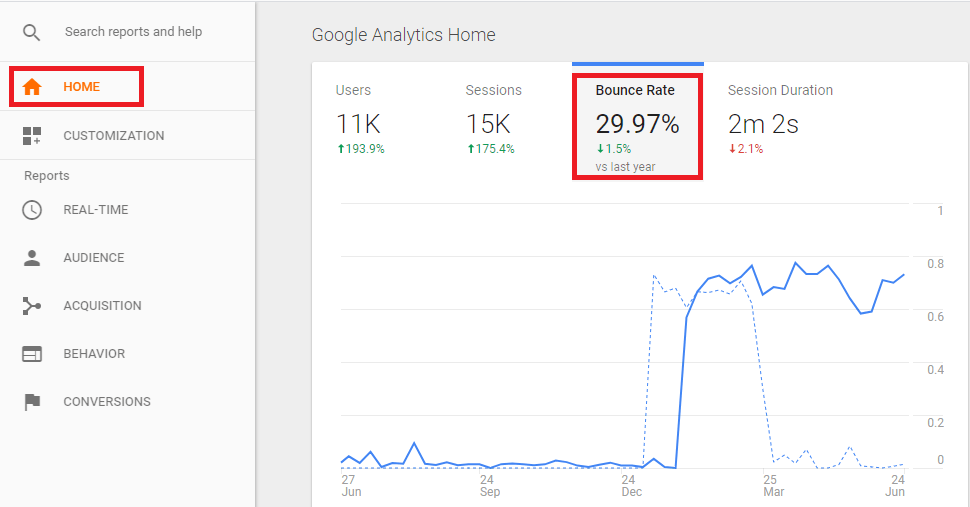
After logging in to your account, you will get the performance overview of your website. It shows the total number of sessions, users, bounce rate and session duration of the past week by default.
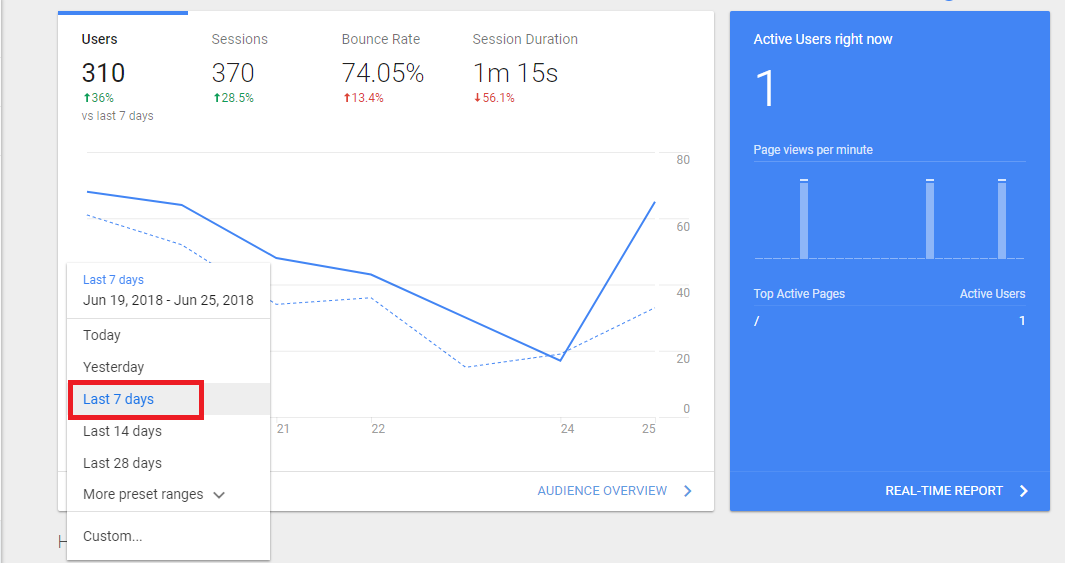
If you want to select a custom date range, just click on the drop-down menu displayed above and select the duration.
If you had started a content marketing plan within the date range you selected, it’ll tell you how well it worked.
2. Top locations where your audience is visiting from
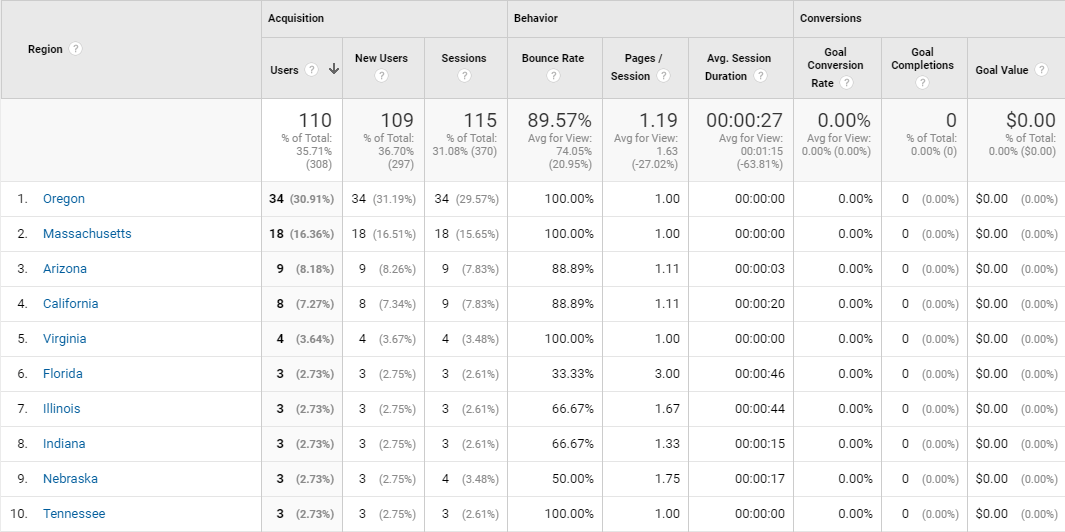
Go to Audience > Geo > Location and you will find the locations from where most of your users visited the website.
As the image shows, the website got the most number of visits from the United States. Click on ‘United States’ and you will learn about the regions where your website is the most popular.
You can also learn about the most popular cities by clicking on the regions.
If you want to know about which pages got the most visits from a particular city, click on the city and search for “Landing Page” in the drop-down menu of “Secondary Dimension”.
As you can see, the landing page “/website-design-toronto/” is quite popular in Boardman. Therefore, promoting web design related content here can prove to be beneficial.
3. Type of website content getting the most number of visits
If you post regularly and are engaged in an extensive content marketing program, then learning about the types of content that are attracting the most visitors to your website is necessary. For example, if you find that your users are spending more time on Blog #1 than Blog #2, it would be better if you write on a topic related to Blog #2.
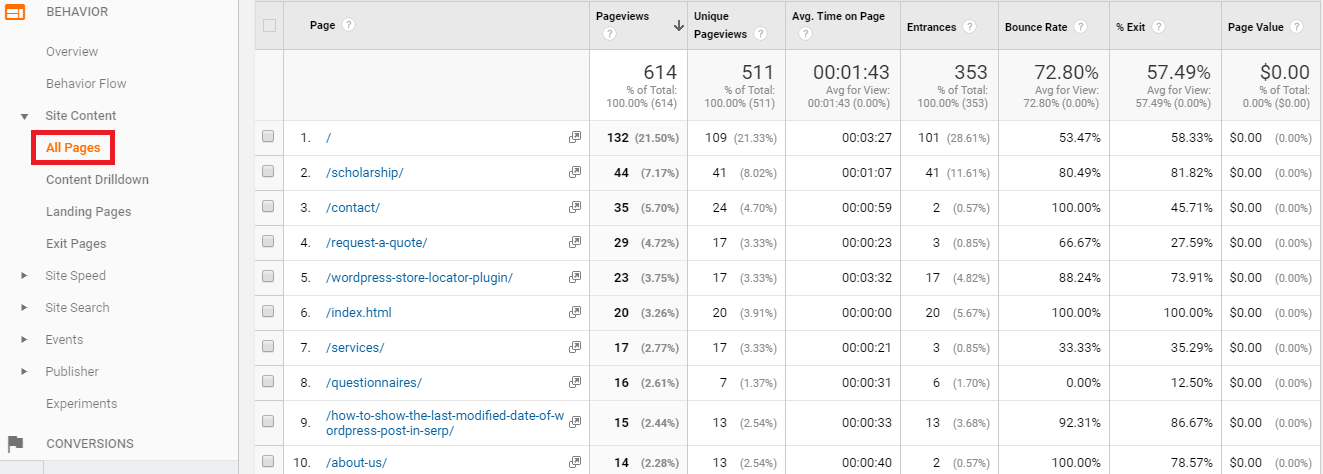
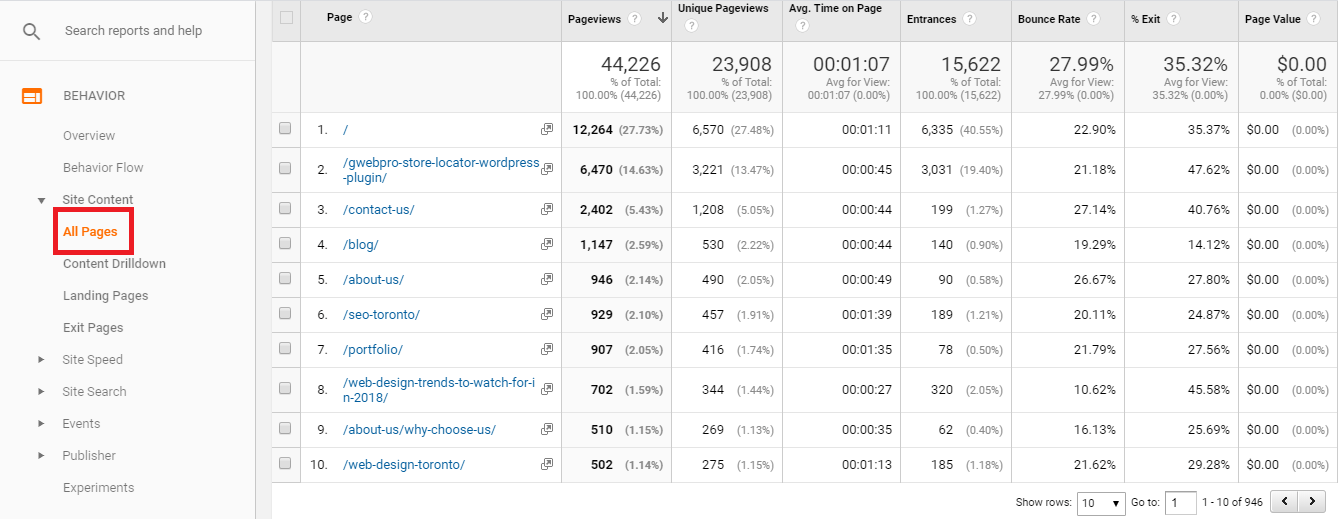
To learn which pages on your site are generating the most traffic, go to Behavior > Site Content > All Pages.
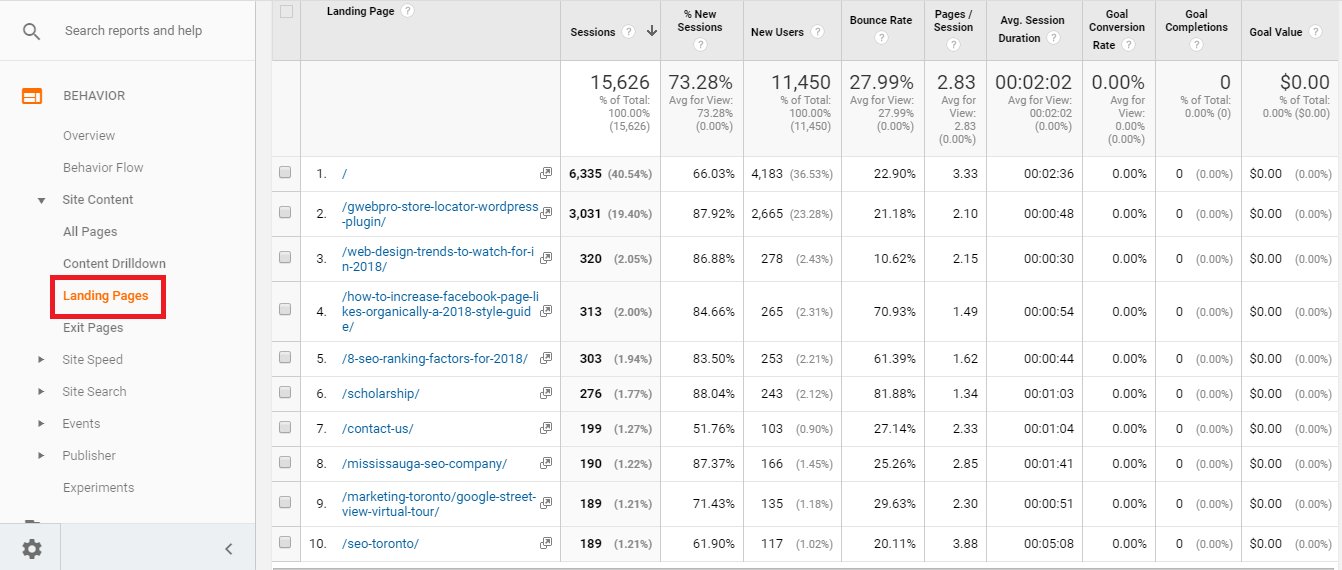
If you want to know which landing pages are attracting the most users, go to Behavior > Site Content > Landing Pages.
4. The most active sources and mediums where you are getting traffic from
The best sources or mediums for your content is another essential piece of data that you need to know.
Google Analytics will not only tell you where you can find your potential users but also let you know what type of content is useful for a particular platform.
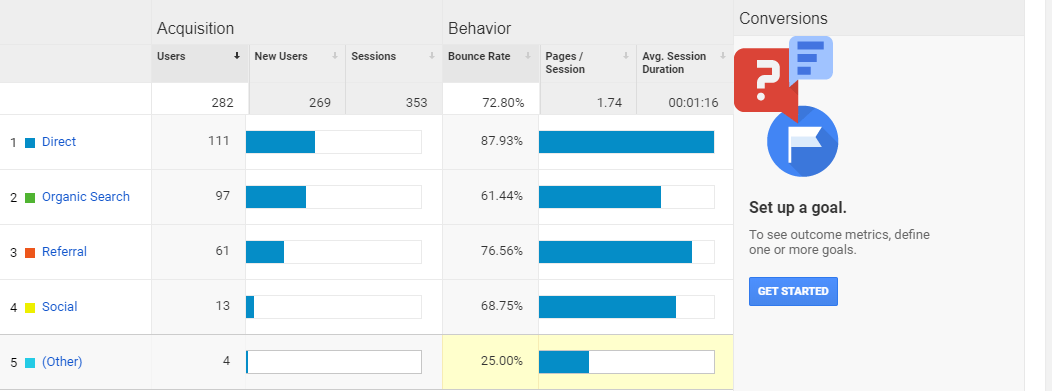
To find it, go to Acquisition > Overview.
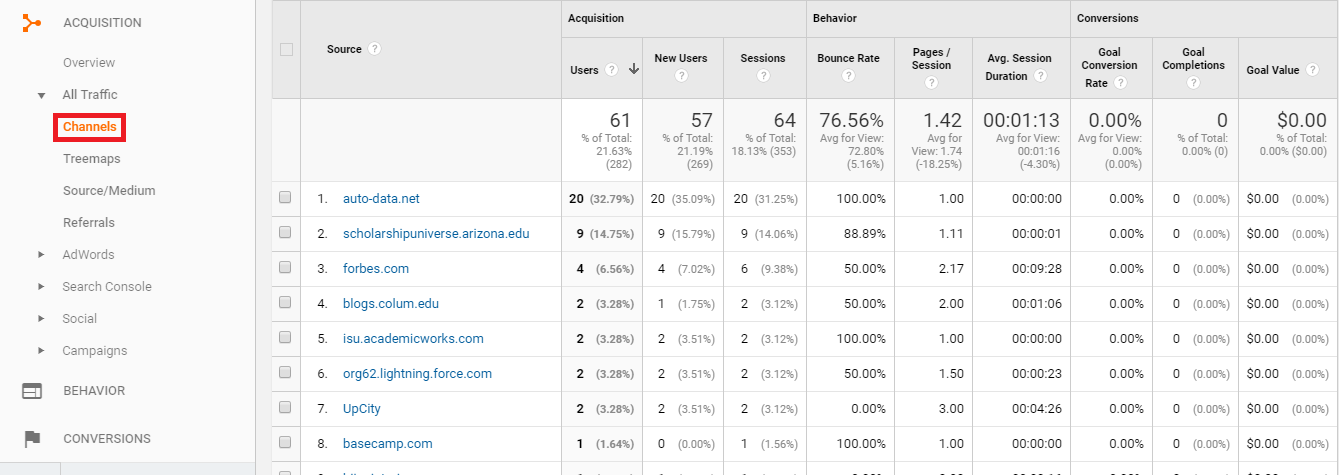
If you want to learn which sites are your main traffic sources, click on each channel.
To find out which pages were visited from these sites, click on a particular site and select “Landing Page” in the “Secondary Dimension”.
You will now know whether the content promotion on a particular site worked.
5. Types of devices your visitors are using
Businesses today are more focused on targeting mobile users and for good reason. As of February 2017, 49.7% of web page views worldwide were received from mobile devices. That should give you an idea of the devices that your potential users prefer the most.
Go to Acquisition > Overview. You will find all the channels where your website has got traffic from.
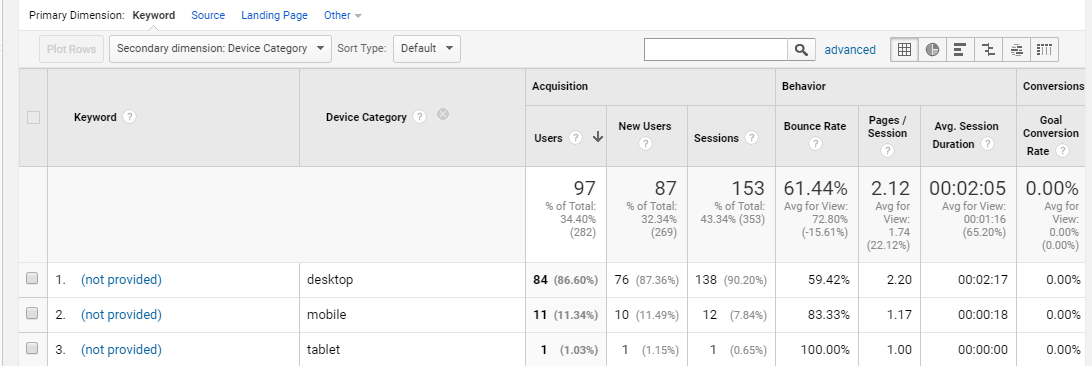
Now click on each channel and select “Device” from the “Secondary Dimension”.
This will tell you which devices are most used to visit your site.
As you can see, there are 84 visitors from desktop, while 11 are from mobile and 1 is from tablet. Therefore, the primary target for the website should be the desktop users. Any optimization on the site must be made with a desktop-focus in mind.
6. Fields of interest of your audience
Knowing which fields your visitors are interested in gives you a lot of insight into how to best develop your content marketing plan. For example, if you are in the tourism industry and find that photographers are frequent visitors to your site, then you can offer different opportunities for them specifically to use your service. Another tactic would be destination-related content for a photoshoot.
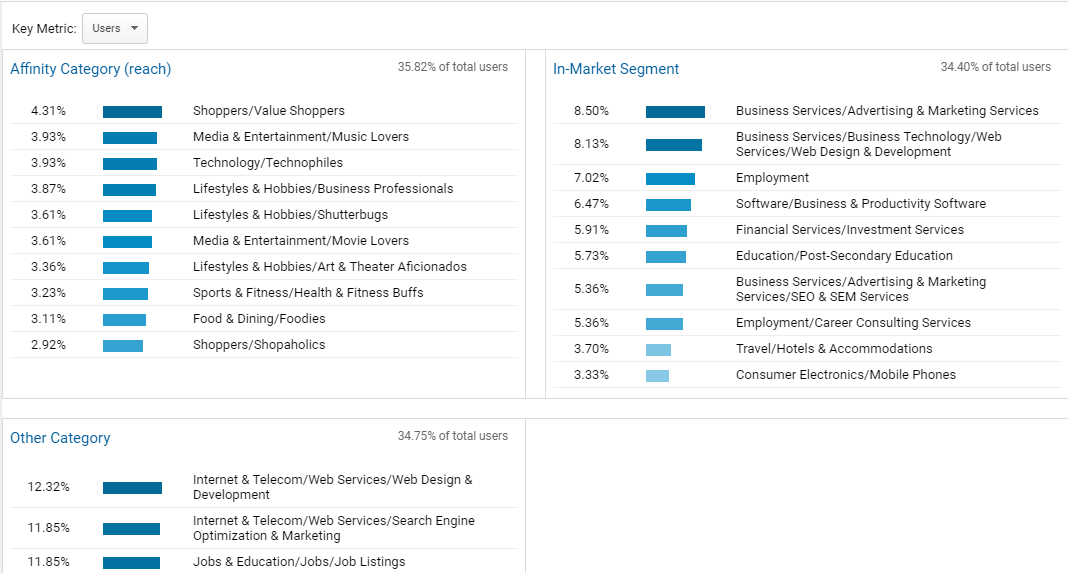
To check the fields of interests you need to go to Audience > Interests > Overview.
The affinity category represents the users who have a natural liking for the products and services you are selling. Users within the in-market segment are the most active users of your website. Targeting people from both categories is an effective tactic.
7. User behaviour
To make your website more user-friendly and send users to the pages you want, you need to know how they behave after visiting your website. They may bounce back from the page they have landed on or visit other pages on your site following the call to actions. To be certain how they are interacting with your website content, you need to know their behaviour.
You can find it out under Behavior > Behavior Flow.
8. Bounce rate of the website or a particular page
Bounce rate is a major ranking factor. Having a huge bounce rate means the content on your website is not beneficial for the users, resulting in the rankdrop. Therefore, generating lots of content regularly can’t give you a good rank if you don’t know whether the users actually like it.
You can find out the bounce rate of your website on Google Analytics Home.
If you want to know about the bounce rate of a particular landing page, you need to go to Behavior > Site Content > All Pages and Behavior > Site Content > Landing Page.
9. Track Conversions
If you want to track conversions your website has received, you need to set up goals on your Google Analytics account. Analytics will also show you the path that visitors used to complete the process of conversion.
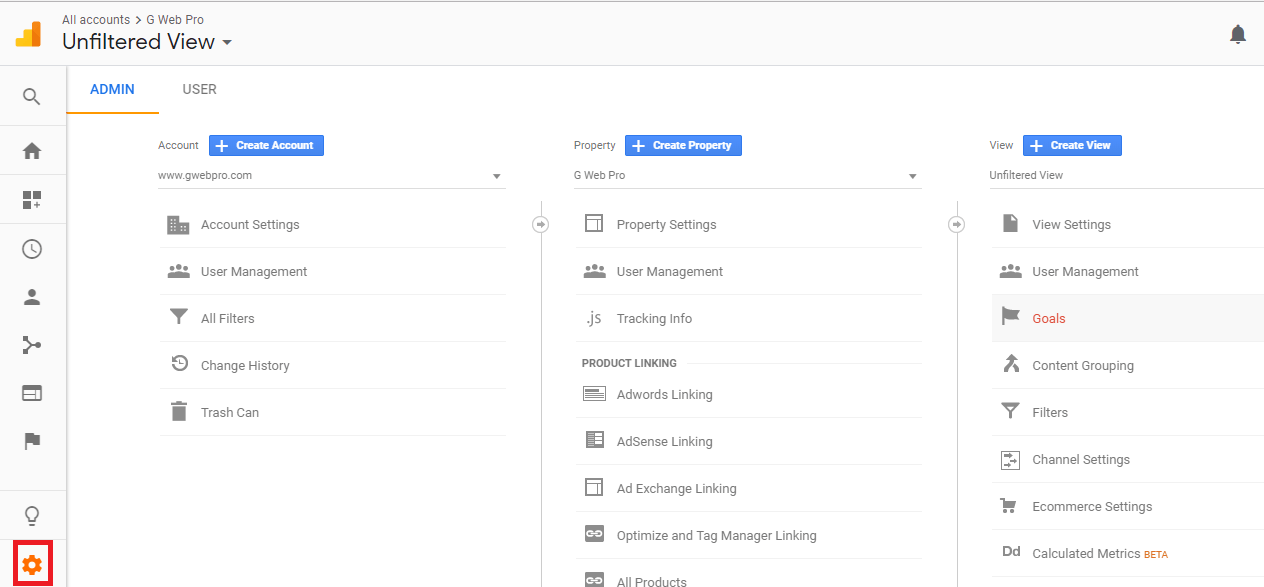
To set up goals, you need to click on the settings icon down the left corner and select “Goals”.
Setting up goals will let you know whenever something important happens on your website. For example, if you are running a lead generation website, you will want to be notified when someone visits the confirmation page after submitting the contact form.
To set it up, click on the “New Goal” button after visiting the “Goals” page.
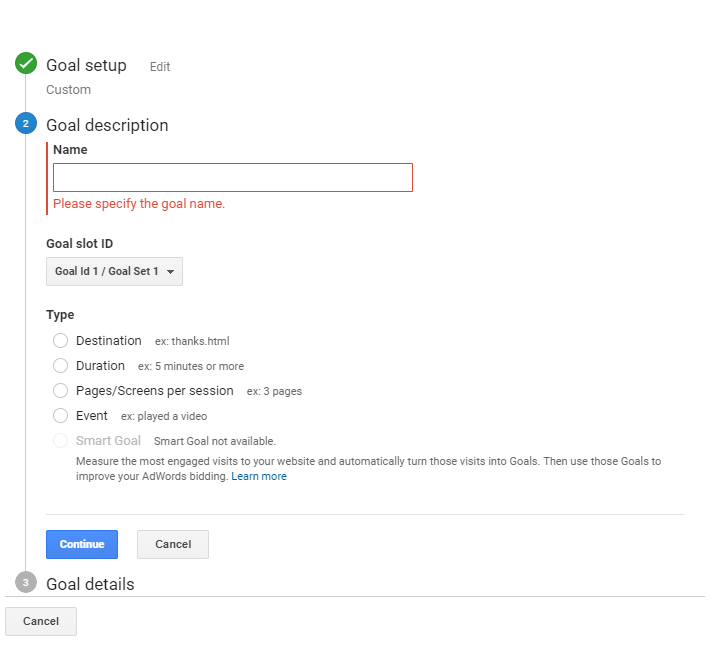
After that’s done, you need to choose the “Custom” option and click on the “Continue” button.
Give your goal a name and select “Destination” option and continue further.
Next, you need to enter the URL of your thank you page in the destination field and select the “Begins With” option from the drop-down menu and click on the “Save” button. That all you have to do to create your goal.
To track the conversion, go to Conversion > Goals > Overview.
Find the paths users have completed the conversion by clicking on “Source / Medium”.
10. Load Speed
You can check the load speed of a particular page from Google Analytics. Go to Behavior > Site Speed > Overview > Page to learn about the average page load time of different pages.
To improve the load speed of web pages, use the Google Page Speed Insights tool.
Click on “Browser” to check the average load time of your website on different browsers.
With the help of a tool like GTMetrix, you can improve the load speed of your website on different browsers.
It allows you to check your website’s speed in different countries by clicking on “Country”.
If you find that the load speed is not good in a particular country, you should contact your hosting provider and ask what you need to do.
And that’s it! You have now have what it takes to better understand your users and realize new marketing opportunities. Identify the users who are interacting with your site, find out the pages that are receiving the most number of clicks, and target the locations from where people are visiting your site.
So, what are you waiting for? Explore Google Analytics today and see what the digital world has to offer you!


